Quantitative Data Analysis
We usually need some kind of quantitative statistics to reduce our risks during Business Design sprints. Get an overview of what data sources we typically use and how we analyse and display them for the team.
Content
1. Overview
Some activities in the Discover Phase (especially to answer open questions about your current business model, the behaviour of your customers and users) as well as experiments of the Validate Phase require the collection and analysis of large amounts of data with the help of descriptive or inferential statistics. Data sources could be
Behavioural data collected by the help of Automated Tracking
Internal applications (e.g. CRM, ERP, issue tracking systems, SCM)
Social Media (e.g. Facebook, Twitter, Youtube and LinkedIn)
External applications (e.g. AppStore, Google Ads)
Any quantitative data analysis is usually based on basic key statistics. Choose the ones that are appropriate for your data and help you get answers to open questions or to validate your hypotheses. Before starting the analysis, you probably have to prepare and edit your raw data in a spreadsheet (e.g. check for completeness and remove errors). Make sure you present the insights you generated in a very clear and understandable way. Map your data to the questions and hypotheses you have in a dashboard.
Funnily enough, we've observed that most people have no interest in validating their business models. Tangible prototypes and feedback from a small number of customers makes them more happy than quantitative statistics that actually reduce their risks. Making things concrete can make people feel scared.
2. Key Elements
Statistics | Description |
Frequencies | Count of the number of times a particular value is found |
Percentages | Set of values as a percentage of the whole |
Mean | Numerical average of the values |
Median | Middle attribute in the ranked distribution |
Mode | Most frequent value |
Range | Distance between highest and lowest value |
Variance | Variability of the distribution |
Standard deviation | Amount of variability: a high standard deviation means data are more dispersed |
Correlation | Describes the relationship (strong, weak, statistically significant) between two variables |
ANOVA | Determines whether the difference of two samples is significant |
Regression | Determines whether one variable is a predictor for another one |
3. Usage Scenarios
Explore your current business model, practices & processes and behaviour of your customers & users in the Discover Phase
Explore antilogs from your Hypotheses & Experiments template
Validate hypotheses from your Hypotheses & Experiments template
4. Example Tools
5. Q & A
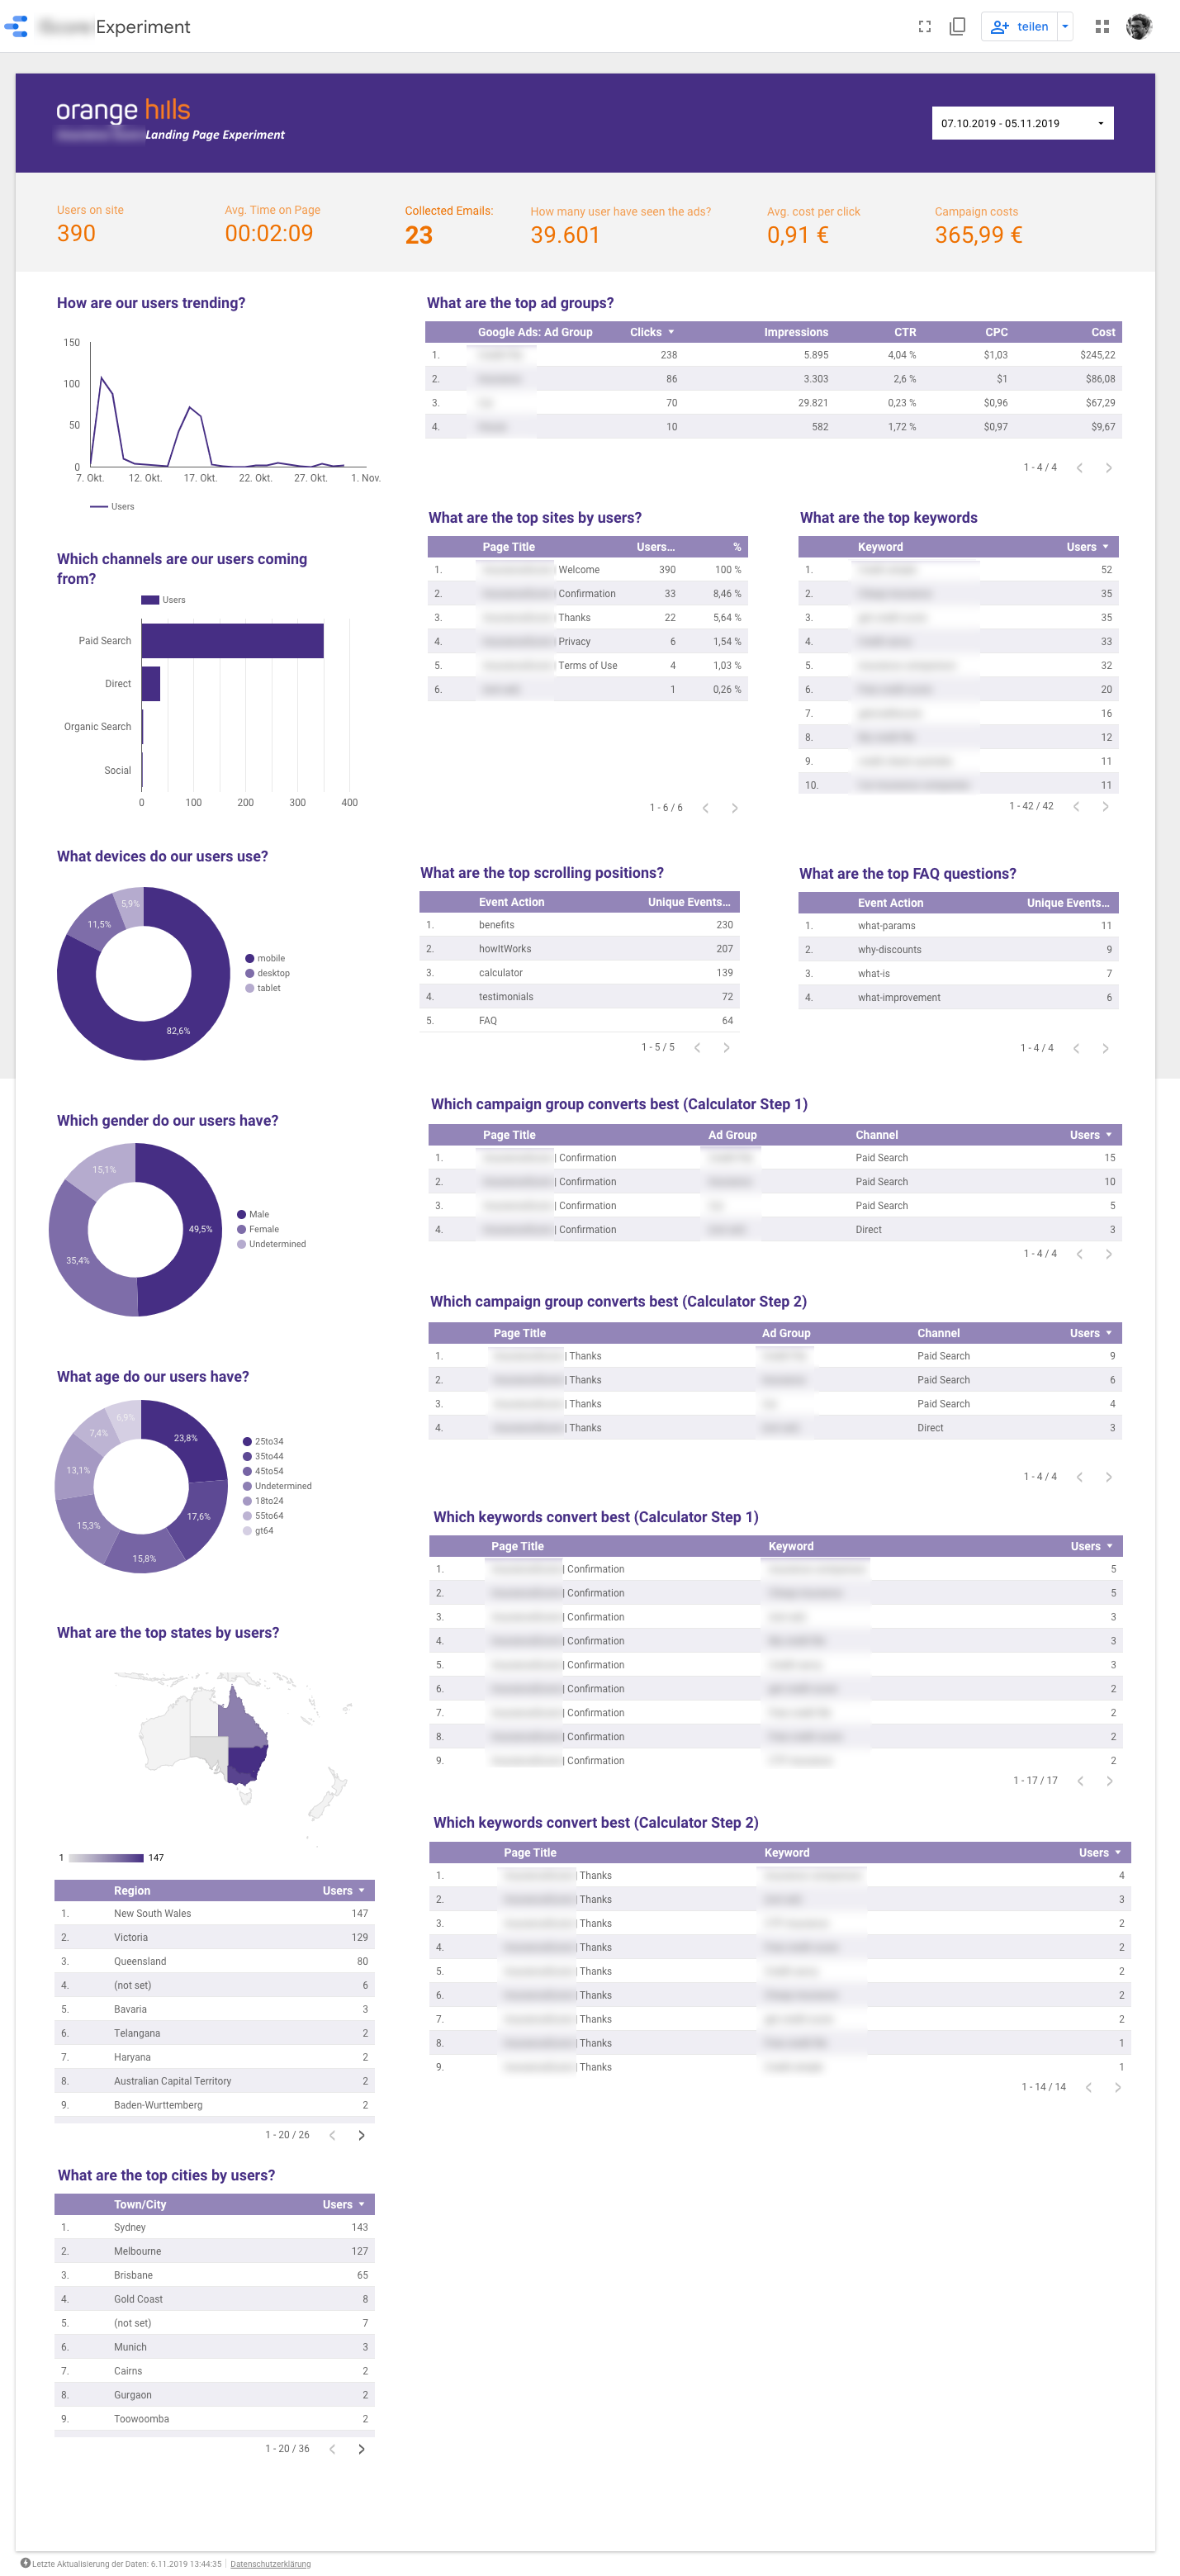
How can I build meaningful dashboards and integrate all these different data sources (Google-/Facebbok-/Twitter-Ads, Google Analytics, custom data)? Have a look at Google Data Studio. There is no coding necessary and you can integrate many data sources out of the box.
How can I track custom user behavior on our site (Downloads, Configurator-Actions, Scroll-Positions etc) within Google Analytics? Have a look at Google Analytics Custom Events.
6. Example Dashboard